Measurements & outputs
Measurements and outputs
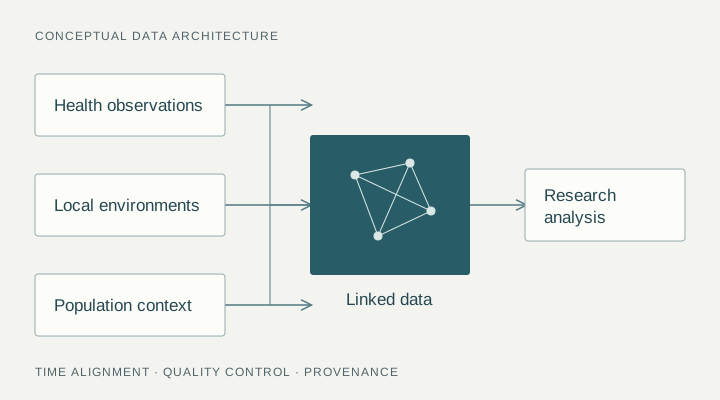
- Linked entities (nodes) and explicit relationships (edges).
- Queries across individual, household and environmental layers.
Research workflow
Research workflow
Map source schemas and relationships while retaining time and provenance.
Use governed identifiers and access controls, then evaluate whether linked queries answer the scientific question.
Interpretation & current limits
Interpretation and limitations
- A graph makes relationships explicit. It does not by itself remove bias, establish causality or validate prediction.
- Real participant data require controlled access. The website provides an explanatory illustration, rather than access to a research database.
Documented applications & research context
Applications and research context
Projects
Research settings
Publications & evidence
Related publications
Read the study-specific methods, results and limitations. The framework paper describes the wider approach.
2026Related research evidenceData architecture
Yan et al. · Studies in Health Technology and Informatics
Shows how Nouna population, weather, wearable and indoor climate datasets can be linked in a knowledge graph.
Methods, findings & limitations ↗2023Methods / scientific contextMethods
Barteit et al. · Frontiers in Public Health
Introduces the modular CHEERS framework linking population surveillance, environmental measurements and individual health data.
Methods, findings & limitations ↗Explore the full publication library ↗Methods in exchange
Related workshops
Source & scope
Sources and scientific context
Content and images draw on Sandra Barteit’s Freiburg lecture, The Impact of Climate Change on Human Health: Lessons from Low- and Middle-Income Countries, slides 17, 60, 61, 62, 63, 64. Publication pages provide the corresponding research evidence. Reviewed 12 November 2026.
Images extracted from the lecture retain the original device or research illustration. Product images identify examples used in the source material.